Nowadays, with the plethora of anti-anti-debugging plugins for Olly, you don’t need to know nearly as much as you used to about anti-debugging techniques. But the problem is, without understanding how they work, when we are confronted with a new technique we find that we have no idea how to overcome it. Additionally, learning about anti-debugging techniques helps us understand low-level protections, and is a good introduction to packers.
Anti-debugging is a rather large field, and impossible to cover in one tutorial. I do hope to shed some light on the most used techniques, as well as direct you to getting additional information on some of the more obscure. I have uploaded several documents to the texts section of the tools
page, as well as descriptions of these at the end of this tutorial, which will have a lot more detail on these and other techniques.In this tutorial, we will be going over a crackme from hell that I wrote specifically for this tutorial. It shows several methods of anti-debugging. It is a very challenging crackme, and as such, this tutorial will be somewhat long and detailed. We will be comparing the source code (in assembly) along side the compiled code in Olly, so dust off that ASM book. As always, you can download all of the accompanying files from the tutorials
page.In order to make this tutorial a little less painful, I have included a picture of the entire source code, a picture of the entire disassembly (in Olly) with comments, and the assembly project for RadASM with source code, all available in the download of this tut. This way you can refer to the source and disassembly while you progress. I have also included an Olly UDD file with the disassembly fully commented. If you wish to see the crackme fully commented in Olly, just copy this file into the UDD folder in Olly, open it in a text editor, and change the file path at the top to match the path to the crackme.
My suggestion, if you would like to get the most from this tutorial, is to use a clean version of Olly with only my .ini file, meaning no plugins. Many of these techniques will still work with plugins, but this way you can see how they work without any intervention. It will also teach you about what a lot of the options in the various anti-debugging plugins are for. I will personally be using a clean install of Olly to show each technique.
Introduction
Anti-debugging techniques are methods used to fool debuggers, making the reverse engineers job harder, attempting to make the job so hard they won’t want to spend the necessary time cracking the target. Some of them work on static disassemblers (like IDA Pro) and others on debuggers like Olly or SoftICE. Debuggers can be split into two types, linear sweep and recursive traversal, and some anti-debugging techniques target those specific types. Others work on all debuggers as they exploit flaws in the mechanics of debugging in general.
One of the most obvious anti-debug techniques is code obfuscation. This simply means making the code as difficult to read as possible, making the reverser’s job much tougher. This includes methods such as spaghetti code (jumping all over the place), encrypting strings,making method call names meaningless (for interpreted code like VB and .NET), and code flow obfuscation where the flow of code does not follow in a linear direction.
Another type of technique is self-modifying code and polymorphism. We were gently introduced to this technique in an earlier tutorial, though these methods can become extremely complicated. This technique is used heavily in some of the more robust viruses and malware out there. Self-modifying code is a technique where the actual opcodes of the binary are changed dynamically (at run-time), making it impossible to see what the code does without stepping through it. Polymorphism is the technique of changing binary code, while still maintaining the same functionality, each time the binary is copied.
Still other techniques have to do with the way the operating system handles debugging. These include calls to Windows API functions that tells us if the target is being debugged, checking for breakpoints dynamically in the code, removing hardware breakpoints, and using known bugs in debuggers to attempt to crash the debugger.
We will be discussing several of these techniques, though rest assured, there are always methods out there far more complicated than we will see here.
Introducing Our Crackme
Go ahead and run AntiCrackme1.exe outside of a debugger to see how it acts when not being debugged. Besides the anti-debugging code, it is just a simple window, asking for a serial:
It displays a goodboy or badboy depending on the serial entered:
Loading the target in Olly:
and looking around a little, you can immediately tell that there is something different about this binary:
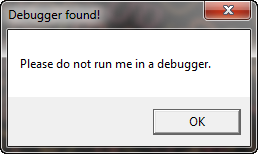
Running the crackme in Olly gives us this wonderful message:
The Beginning
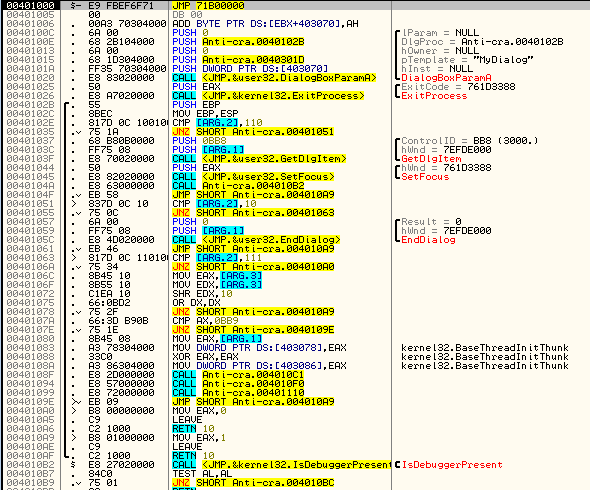
Looking at the beginning of the crackme we can see that it starts with the traditional way of setting up a dialog box as the main window. If you place a breakpoint at address 40100C and then single step, as soon as you step over the call at address 401020 to DialogBoxParamA, you will notice that the entire application is contained in this call. This is because all of the code is run from callbacks based on the events of this dialog box (reminds you of Visual Basic,right?):
In Windows, if a dialog is used as the main window, there will be a main callback that is first called, usually named “DlgProc”. To find the address of this main callback, we look at the variables passed to DialogBoxParamA, and we see, in the picure above, the “DlgProc” contains a value of 40102B. This is our main DlgProc callback address.
Looking at the source code, we can see that this is a pretty straight forward affair:
So what we want to do is place a BP at this DlgProc address and run the target, letting Windows run through till the callback gets called, and then pausing here. Place a BP at address 40102B (the address we saw above) and run Olly. We will break at the beginning of DlgProc:
We can see that, first, we compare a passed in argument with 110h, which is the ID for the Windows message WM_INITDIALOG, or the dialog initializing code. If you are a little hazy on Windows messages, please go back and re-read my tutorial
on Windows messages.In this section there is a call to GetDlgItem and SetFocus. These just make the serial edit box have focus when the window is first loaded, so that if we start typing, the text will display in the serial box. Looking at the source code, we can see how we accomplished this:
One thing you may have noticed in the source is the call to CheckDebug. This call appears at address 40104A in the disassembly. Following this call (single-step into) we jump to the CheckDebug routine:
and following the call, we get to the CheckDebug method which includes a call to IsDebuggerPresent:
IsDebuggerPresent
One of the oldest (and most used) techniques is the IsDebuggerPresent API call, probably because it is extremely easy to use. When a binary is being debugged, Windows sets a flag in the PEB, or Process Environment Block representing this fact. The PEB is a section of code reserved with every process running on the system, setup and initialized by the Windows loader. The PEB contains information that the process needs, such as info on loaded modules, the number of processors in the system, and most importantly, a flag depicting whether the current process is being debugged or not.
A simple query to this API returns a TRUE if the current application is being debugged, and FALSE otherwise. Seeing as this is one of the most used techniques, it’s also the first one used in the crackme:
*** We could also forgo calling the IsDebuggerPresent API directly, thereby removing it from the list of intermodular calls, by doing something like this:
MOV EAX, FS:[00000018]
MOV EAX, [EAX + 0X30]
CMP BYTE PTR [EAX + 2]
JNE IsBeingDebugged
which will load the value of the debug flag directly from the PEB, accessed through the FS register. ***
As we can see in the disassembly, we call IsDebuggerPresent, and if it returns true we jump to the call at address 4010BC, which displays the ‘Found debugger’ message:
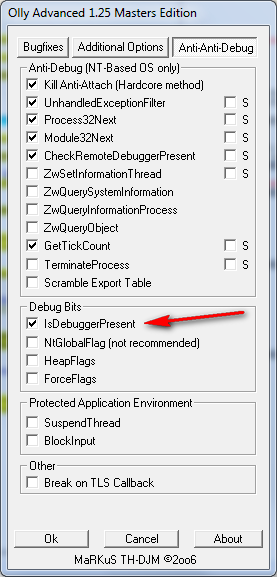
Overcoming the IsDebuggerPresent call is pretty easy in Olly as there are many plugins that do just this. The one I use is the OllyAdvanced plugin. Clicking on this (in a version of Olly that has this plugin) brings up the main settings screen. Clicking the “Anti-Anti-debug” tab, we can see where we tell OllyAdvanced to always return FALSE on a call to IsDebuggerPresent:
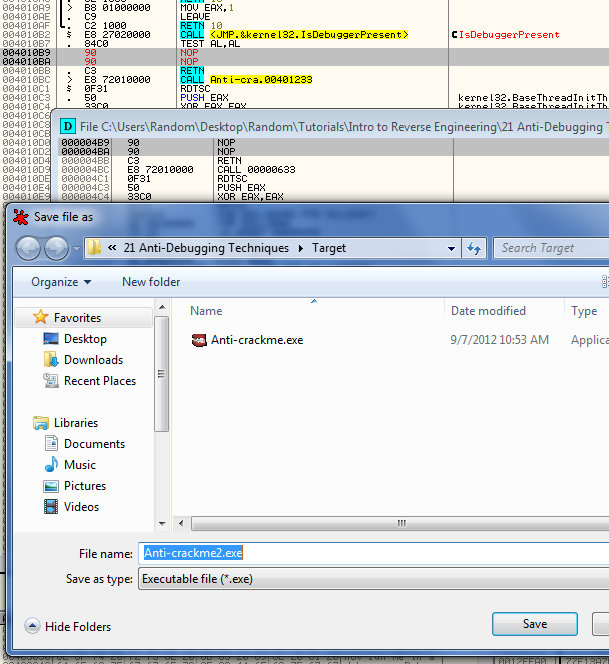
In the mean time, as we are using a ‘clean’ install of Olly, we will disable this manually by patching the check for the return result of IsDebuggerPresent at address 4010B9. Simple right-click on this instructions and select “Binary”->”Fill with NOPs”:
My suggestion would be to save this new version of the patched file so we don’t have to re-apply the patch every time we re-start the target. Go ahead and do that and call it Anti-crackme2.exe:
Now load this new binary in Olly and let’s continue. Set a breakpoint at address 401080. This is in the main callback, DlgProc, but after the INITDIALOG message code. Putting our BP here will save us having to press F9 many times when the target is first loading as the callback will be called with every Windows message that comes through, even if we don’t do anything about them. The only message we care about right now is the WM_COMMAND message for when our “Check it” button is pressed, and our BP is set right at the beginning of this:
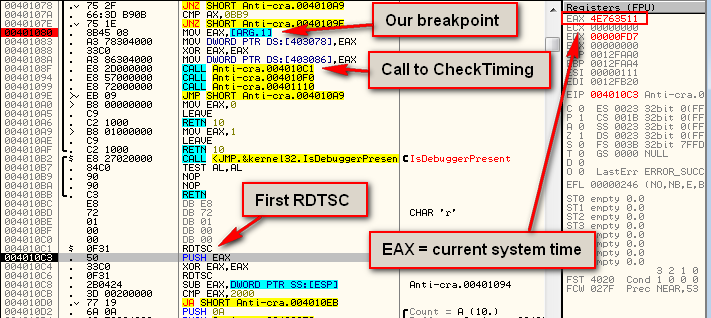
When you first pressed F9, the main screen will appear, asking for a serial. Just enter any serial and click the “Check it” button. Olly will then pause at our breakpoint:
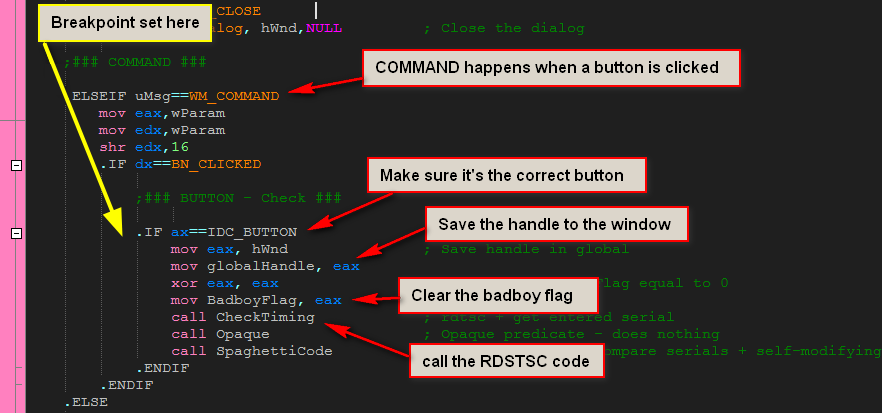
When we press the “Check it” button, a WM_COMMAND message is sent through the DlgProc callback. The first thing we do is make sure the ID matches our button’s ID, and since there’s only one button, it will. Next we save the handle to the window in a global variable so we can access it in other functions. We also reset the badboy flag back to zero (a flag used later to tell us whether the badboy should be shown or not), and then we call the CheckTiming method.
GetTickCount and RDTSC
When single stepping an executable, obviously the code does not run anywhere near as fast as if we were running the app in ‘real-time’. We can take advantage of this fact and measure how long a particular section of code takes to run. If it takes longer than a certain amount of time, we can assume that the code is being single-stepped.
There are several ways of doing this; we could call GetTickCount before a section of code, which returns the amount of time the OS has been running, then call it again after the section of code and compare the two. If this delta is too large, we can assume that the code is being stepped.
Another technique is to use the rdtsc assembly instruction, letting the processor itself handle getting the time. Rdtsc stands for Real-Time Stamp Counter, and is a supported instruction on Intel chips. When called, EAX___ is returned containing the current amount of time the OS has been running. Again, comparing this value before and after a code section allows us to see how long it took to run that code.
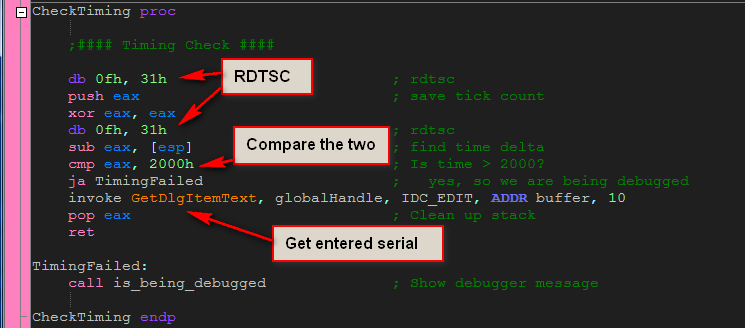
In the included crackme, we can see the use of rdtsc, though one thing needs to be pointed out; RadASM (the IDE I use) does not allow you to enter the rdtsc instruction directly, so we must insert the opcodes manually. The opcodes for this instruction are 0F 31, and in the source code you can see that I just enter them like I would raw bytes:
So, single stepping into the call at address 40108F to the CheckTiming routine, we see that first we run the RDTSC instruction which loads EAX with the current system time:
Stepping down until just past the next RDTSC instruction (to address 4010CB),we see that, after subtracting the first time from the second, the time between them was quite a bit bigger than our allotted 2000h:
In this case, E0557554 ticks occurred between the two. Yours will be different, depending on how long you waited between the two RDTSC instructions, but it will be longer than 2000h if you single step. (You may wonder how I came up with 2000h- I did this through empirical testing. I can’t guarantee that this is the best value, but it worked on all the systems I tested it on.)
There are two ways of combating this anti-debugging technique- you can NOP it out or you can simply ignore it but not single-step through this function. Either way works, but for simplicity, we will just ignore it and remember to not single step through this code. In order to get by it this first time, I just reset the zero flag at the JA instruction at address 4010D0 to bypass the target displaying the “Debug” badboy. Also, make sure that the earliest you set a breakpoint from now on is at address 401094 (the instruction right after the CheckTiming call), this way the call into the CheckTiming routine will run in real-time, bypassing this check altogether.
After the timing check, the code then calls the GetDlgItemTextA function call, which get’s a pointer to the entered serial, which we will use shortly when comparing the serials:
and upon returning (to address 401094) we then immediately call into our Opaque Predicate section:
Opaque Predicates
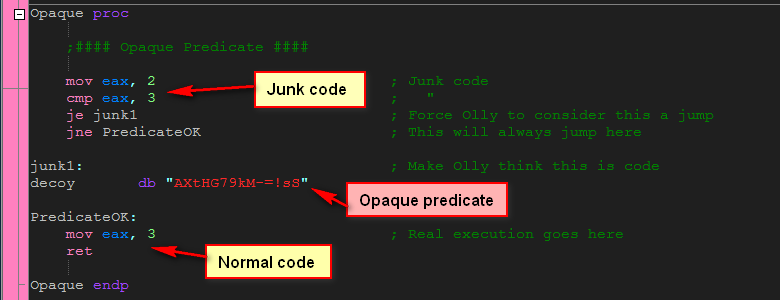
Opaque Predicates are false branches, where the branch appears to be conditional, but is not. For example, if( 1==1) is an unconditional jump, but because of the way decompilers like Olly work, the fact that this is not really a conditional is not known.
In a normal conditional jump, there are two ways the code can go, and because of this the decompiler must disassemble the code for both conditions. In an opaque predicate, we make the disassembler think that there are two ways the code can go, even though there is really only one way it will go. The technique is to set up one of these unconditional jumps, and insert junk code into the code path that will never be called, and real code in the path that will always be called. This will force Olly to disassemble both paths, even though one of them is complete gibberish.
In our example, we see that the number ’2′ is compared with the number ’3′, which will obviously always be false. Well, obvious to us anyway. Olly is not quite as smart, and because of this, he cannot tell that we will never jump to the junk1 code, so he attempts to disassemble this code along with the PredicateOK code:
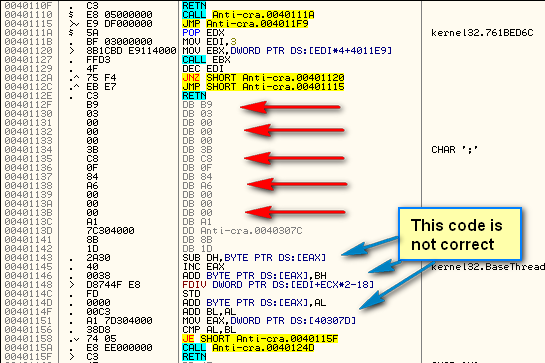
You can see that, in the path that will never be run (the junk1 section), I have simply inserted junk opcodes. I have no idea what these opcodes mean, and frankly don’t care, as this will never be run. Olly, unfortunately, will attempt to disassemble these opcodes and will come up with some crazy code:
The nice thing about opaque predicates is it makes the code appear much more complicated than it really is, making a reverse engineer spend a lot more time understanding the code. In a real application, we could even put real-looking code in the junk, sending the would-be reverser on a wild goose chase. For example, we could put a function that looks like it is comparing the entered serial with a (wrong) hard-coded serial, and then calling a goodboy or badboy depending on the results. Since this will never be run, we can put anything in here, but it will take quite a bit of digging for a reverser to figure out it’s a decoy.
Spaghetti Code
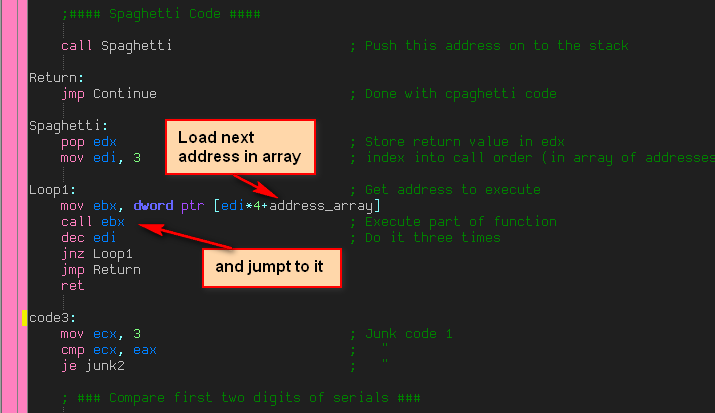
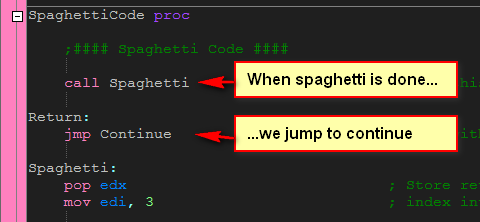
The next call in our WM_COMMAND code calls the spaghetti function, the main function in our crackme:
Spaghetti code is a way to break up a normal, linear, line-by-line execution to a more frenetic, non-linear flow. For example, given the following function (in pseudo-code):
Get serial from user;
Check serial;
if( serial != hardcoded_serial)
Show badboy;
else
show goodboy;
we can change the flow to be more like this:
Jump to Spaghetti1
Spaghetti6:
Show goodboy
Jump to End
Spaghetti3:
if( serial != hardcoded_serial)
jump to Spaghetti5
else
Jump to Spaghetti6
Spaghetti1:
Get serial from user;
Jump to Spaghetti2
End:
Exit;
Spaghetti2:
Check serial
Jump to Spaghetti3
Spaghetti5:
Show badboy
Jump to End
As you can see, this is far harder to follow.
One of the initial things to notice in this code is that Olly has disassembled some of it incorrectly. In this picture, the red arrows show as data and the blue arrows are incorrect disassembly:
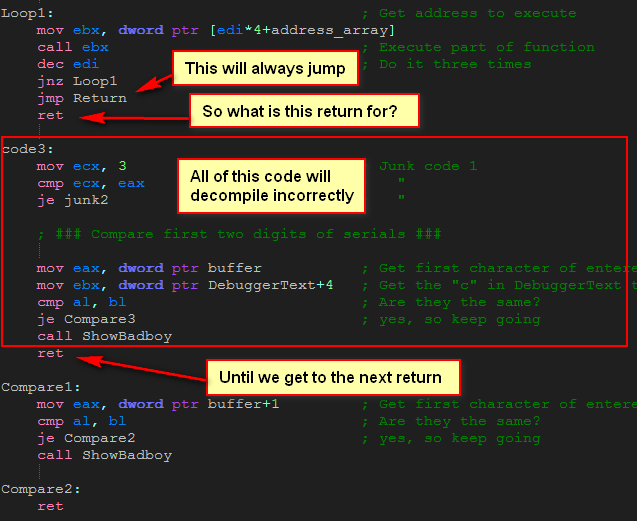
Going to the source code, we can see why Olly has gotten confused:
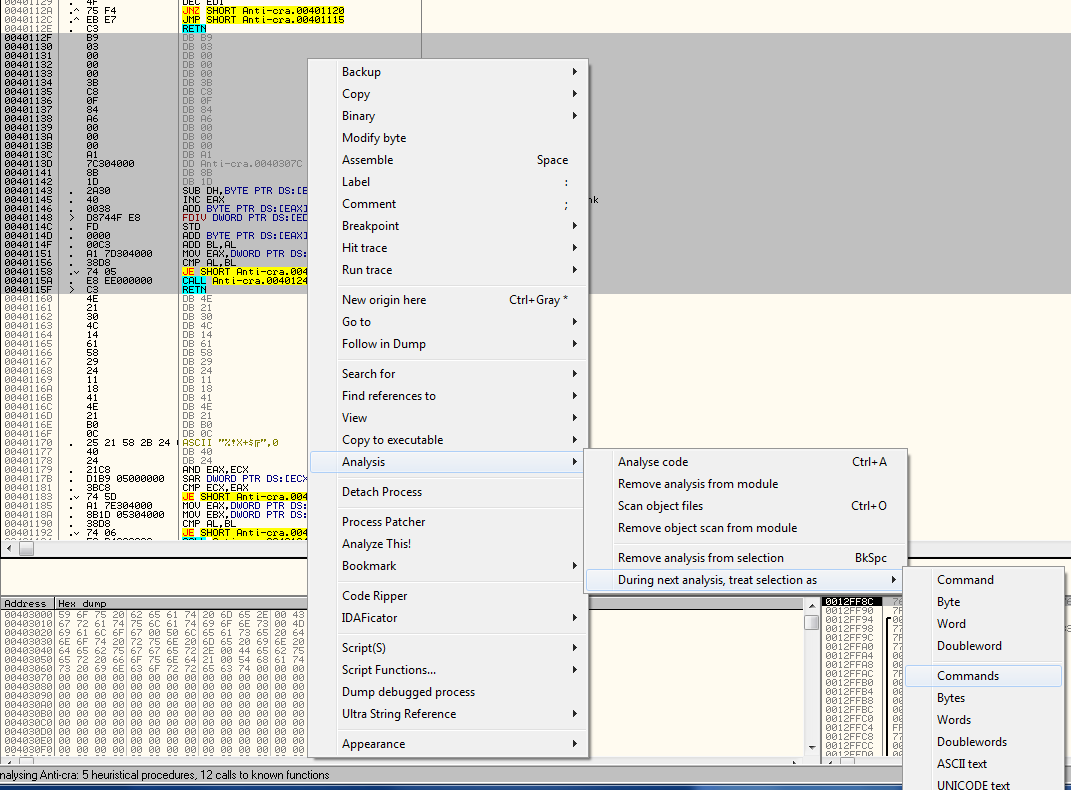
We can see that something similar to an opaque predicate has been used- it is a jump followed by a return. What is Olly to make of this? Well, he resorts to displaying everything until the next return as data. We have to tell Olly that it is in fact instruction opcodes and not data. The way to do this is to highlight all of the incorrectly decompiled code, right-click and choose “Analysis”->”During next analysis, treat selection as”->”Commands”:
Now Olly will re-analyze this section, assuming that these lines are instructions and not data. Now Olly shows the correct disassembly:
That will help as we go through the code!
The Table Interpretation Method
In addition to mixing up the flow of the code, this crackme also utilizes a technique called table Interpretation (there are actually additonal techniques to this, but I am just showing the most basic way). This further obfuscates the code in that it’s a lot harder to figure out where the execution will jump to next. It works by loading several addresses into an array. These addresses are entry points into sections of code. We then enter a loop that loads each address and calls each one in order. These code sections are usually compiled out of order, making it harder to follow the execution.
The ‘normal’ way we would call each section would be something like this:
call code1
call code2
call code3
But in the crackme, the way we call each section is more like this (in psuedo-code):
array = [ 0, address of code 3, address of code 2, address of code 1];
for( i = 3; i > 0; i–)
{
call array[i];
}
This adds a level of obfuscation in that we are calling each section indirectly.
Here we can see the loop that loads each address and calls them, one after another:
and here’s the actual array that holds the addresses:
Another benefit to this is that it inserts data (the array of addresses) into the middle of code, making it harder for the disassembler to disassemble the code:
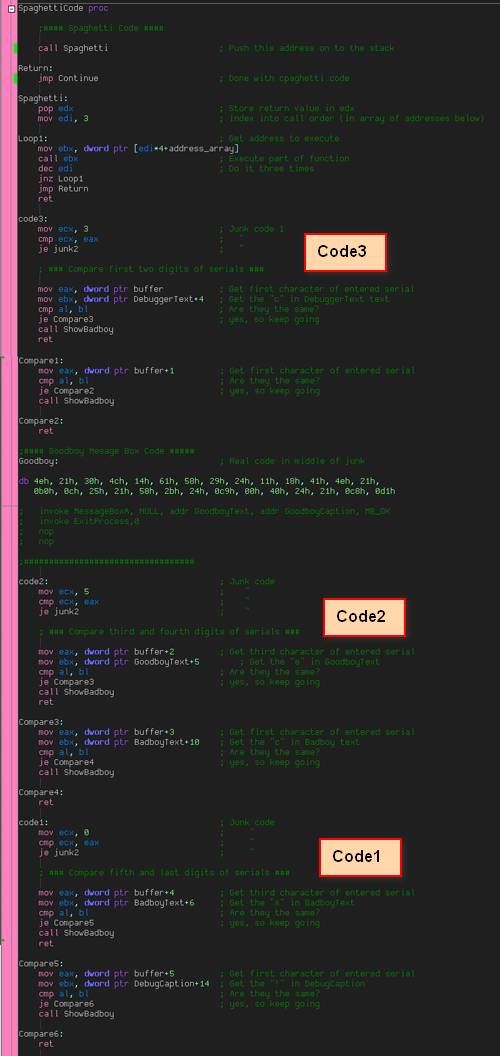
The calls start with the last address and work their way down, so our calls will happen in this order; code1, code2, code3. As we can see, these code sections have been compiled in reverse order, making it more difficult to follow code execution:
Also, junk code has been inserted into the beginning of each code section to lower readability .
Checking Against Pre-Existing Strings
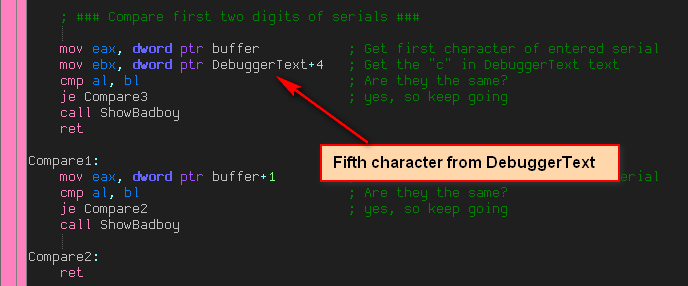
In each code section, a part of the actual pertinent code is run. In the first section (code1) we check the first two characters entered against the first two characters of our hard-coded serial. There is a further obfuscation performed here, though. In order to not have a hardcoded serial (which can be pretty easily detected in Olly), this crackme checks the characters entered against characters from strings that have nothing to do with the serial. For example, the first entered character is compared to the fifth character of DebuggerText:
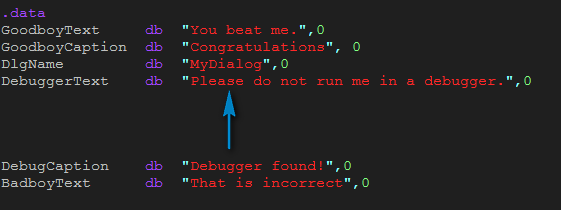
and here is the letter it compares it to:
So we can see that the first character of the entered serial is compared with ‘s’. Right below this check in the source code, we check the second character of the entered serial with this same ‘s’. So we know the first two characters of the serial should be ‘ss’.
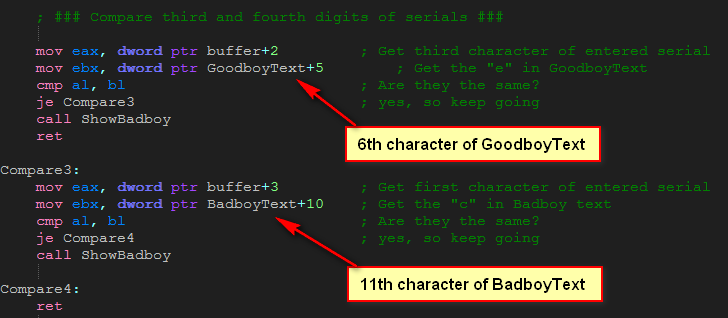
The next compare section checks the 3rd and 4th characters entered with characters from GoodboyText and BadboyText:
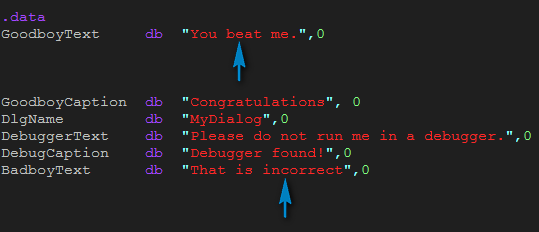
and here’s the strings:
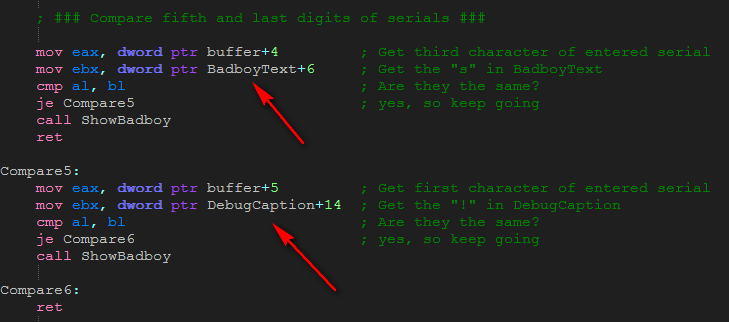
So we know the third character of the entered text should be ‘e’ and the fourth should be ‘c’. Finally we check the fifth and last characters:
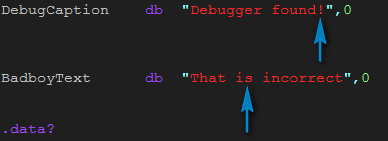
to the appropriate strings:
and we see that the entire serial is ‘ssecs!’.
Searching for breakpoints
After the spaghetti code, the crackme does not return control to the main WM_COMMAND section, instead it stays in this call, as a way to further obfuscate the code. Right after Spaghetti is done, we jump to the Continue label, as we can see here in the source code:
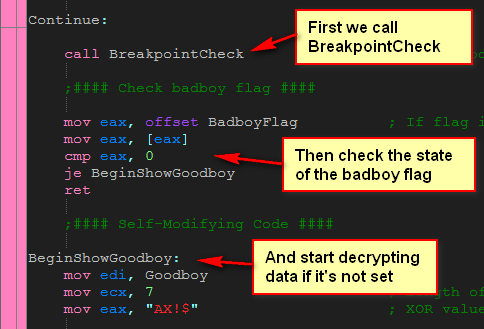
At the beginning of Continue, we immediately call the BreakpointCheck code. After this, we fall through to checking if the badboy flag was set, and if it wasn’t, we fall through to the self-modifying code section:
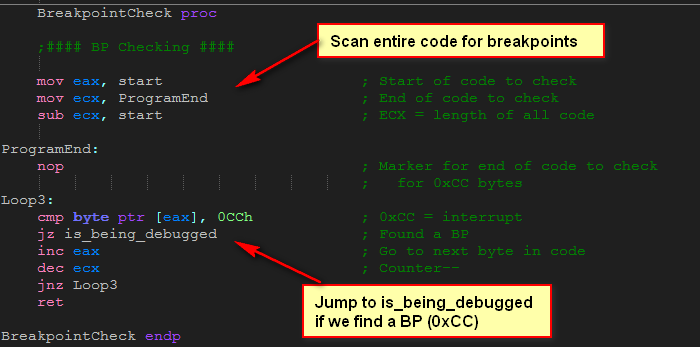
Following is the BreakpointCheck routine. The purpose of this code is to search the entire contents of our application (in memory), looking for a breakpoint. If we find one, we know we’re being debugged and we show the debugging message:
As we will see at the end of this tutorial (in the cheksums section), we will go into more detail of this process. But in the meantime, we need to know when setting a breakpoint, the memory contents of the first byte of the instruction where we place the breakpoint is replaced by the constant CCh. This is the opcode for an interrupt, and Olly is registered to trap this specific breakpoint. This way, as the program is executing in memory, when an interrupt occurs execution is given to Olly by the operating system, and Olly will pause the execution of the executable here, giving us control of the target.
*** Please see the checksums section at the end for a more detailed explanation of breakpoints and interrupts. **
This routine searches our code looking for the tell-tale sign of a breakpoint. If we encounter a CCh anywhere in this code, we break and display the badboy. The beginning address of our program is defined by “start”, the label placed at the top of our source code. To find the length of our code, we subtract the address of the beginning of from the address of the end, which gives us the length. Next we search every byte, comparing each with the constant CCh. If CCh is not found, we simply return from the procedure.
Here’s what the breakpoint check looks like in Olly:
In order to overcome this anti-debugging technique, we simply need to NOP out the call to it. After a little searching, we find the call at address 4011F9:
Highlighting this instruction, right-click and select “Modify”->”Fill with NOPs”. This replaces the instruction with NOP opcodes:
Now we have no more breakpoint check. At this point, I would again save the binary (Anti-crackme3.exe) so we don’t have to remember to apply the patch every time we run the target.
Self-Modifying Code
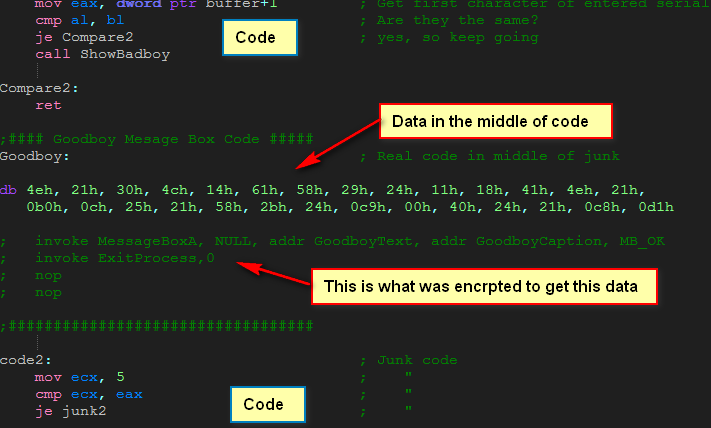
The final anti-debugging technique used in this crackme is self-modifying code. This is a technique whereby the opcodes in the binary get changed at run-time into a different set of opcodes. In the case of this crackme, it changes a bunch of random data into a call to show the goodboy. There are plenty of reasons this technique is used: the function call encrypted in this section will not show up in the intermodular calls, the random data can trick disassemblers into thinking its code, and after the opcodes get decrypted, you must tell Olly to re-analyze these bytes as opcodes instead of data.
There are many more facets of self-modifying code than I have displayed here, some of them next to impossible to work with (but not completely impossible…why? cause that’s impossible…)
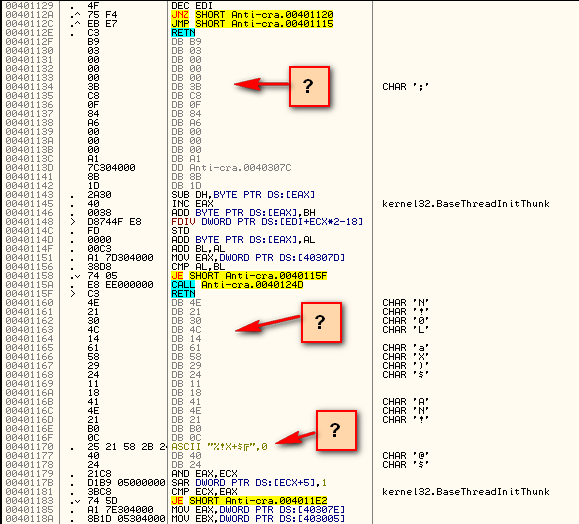
If you look in the middle of the spaghetti code in Olly, you will notice this random data looks somewhat out of place in the middle of code:
*** Because this really is raw data (for now), if we tell Olly to re-analyze this as commands, it will be complete gibberish. ***
Here is the source code for this section. Notice that it defines data in the middle of the code section, and our compiler is more than happy to insert the data amongst the code. Also, I have added comments under the code as to what these bytes will represent once they’ve been decrypted:
In the case of this crackme, the original instructions were simply XORed with a certain key in order to get the raw data. Because they were XORed, XORing the encrypted data with the same key will decrypt them back to their original.
*** Many commercial software titles would do far more than XOR this code to decrypt it, but you’d be surprised how many use simple algorithms. ***
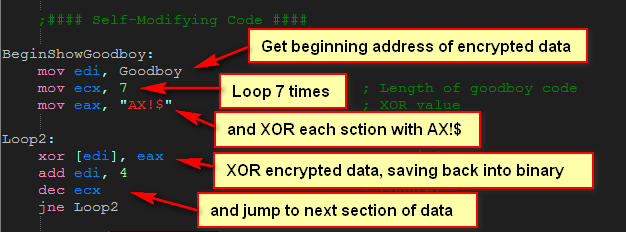
Now, let’s take a look at the code that does the decrypting:
Here, we load the address of the beginning of our encrypted data and load ECX with 7 which is the number of times we will loop through this code. The reason it’s seven is that we will XOR 4 bytes at a time, XORing the 4 bytes with “AX!$”. 7 times 4 equals 28, so we will XOR 28 bytes. You may notice that the call to MessageBox and ExitProcess are only 26 bytes, so I added two NOPs at the end so we didn’t start decrypting the next section of code.
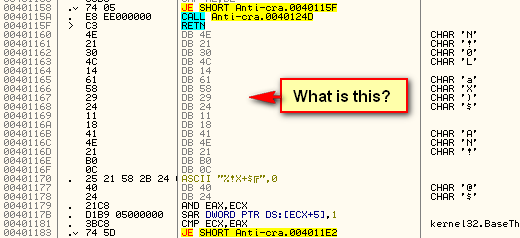
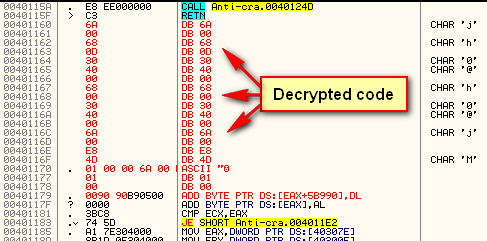
Next we do the actual XORing of the bytes, cycling through all of our data. If you place a breakpoint at address 40120B (the beginning of the decryption routine) and hit F9, each time you run the app you will see a section of code, starting at address 401160, change into decrypted code. Of course, Olly doesn’t know that these changed bytes are instructions, so it tries to disassemble after each pass of the loop. After seven times through the loop, you will see the decrypted bytes in their entirety (keep in mind that you will only see this if you enter the correct serial):
Let’s tell Olly that this is code and not data. Select all the modified lines, right-click and choose “Analysis”->”During next analysis, treat selection as”->”Commands” and we will see the decrypted code as it’s meant to be seen:
We can now see what’s going on!
*** By the way, if you wish to experiment with self-modifying code on your own, there are a couple of additonal things you need to know. At the end of this tutorial, I have included a section on changing PE file section characteristics, so read this before attempting this technique on your own. ***
After decrypting the code, there is one more little surprise we have to deal with…
Return Obfuscation
You can see in the source code that the crackme does not just simply jump to the decrypted code here, but performs some strange computations. This is a simple anti-debugging technique that just makes reverse engineering the code a little harder:
A simple version of return obfuscation is something like this:
push offset code_to_call
ret
What it does is changes a jump into a return. This code is equivalent to:
jump code_to_call
but has the benefit of being a little more complicated in the code, not to mention making Olly’s job harder. Where this technique really shines is in static disassembly, using something like IDA Pro. Because there is a return instead of a jump, it’s a lot harder for IDA, as well as the reverser, to figure out which call this return goes to.
The reason why these two snippets do the same thing is that when the CPU performs a return, it pulls the return address from the top of the stack and jumps to this address. This is the way return works. Well, if you want to jump somewhere, you can push the return address yourself and then perform a return, which does the same thing as a jump.
In the crackme, something similar to this is done, but with a twist. The code pushes the address of the code we want to jump to (the beginning of the new decrypted code) but adding a constant value of 754841h to it. It then loads this value into eax, and subtracts the constant from it again. Finally, it copies the correct value onto the top of the stack and performs a return , telling the processor to pull this value off the stack and jump to it. Here’s what it looks like in the disassembly:
Granted, this is still a pretty easy version of this technique, but it gives you the idea for when you hit a tougher example.
Techniques Not in the Crackme
Here I will go over a couple of additional techniques that were not in the crackme, but that you should be familiar with.
Manually Loading Imports:
This technique is used quite often, especially in malware. It involves manually loading the imports that the binary needs, as opposed to having Windows load them for you. Imports are files like user32.dll and kernel32.dll, and the methods these files make available to our application. GetDlgItemText, MessageBox, and strCmp are examples of these imported functions.
The reason for loading these manually is it removes the benefit that reversers can get by seeing the imports and where they are. For example, one of the first things we do, especially if there are no strings in the target, is to do a search for all intermodular calls. We then look for any suspicious calls that we know are usually associated with protections, and zero in on these. If the target loads imports manually, all you will see in this window are two processes, GetProcAddress and LoadLibrary. This is a sure-fire way of determining if this target loads imports manually.
*** There are additional techniques that can be used to even get rid of the GetProcAddress and LoadLibrary calls, making the intermodular calls window show no function calls. ***
The way an executable does this is it loads in the various DLLs itself, using LoadLibrary, then manually loads in the calls that it will use, saving pointers to these calls internally. When the target needs to call an import, such as MessageBox (with our badboy message), instead of Olly showing something like this in the disassembly:
call user32.MessageBox
it will show something like this:
call [eax]
Obviously, the second method is much harder to follow, as we have no idea what function is being called. Also, having no starting points to follow that target’s flow makes it much harder to reverse engineer.
The only way to combat this technique is to step the code from the beginning and try to figure out what each call is for. We can then manually label these calls in Olly, as a beginning to understanding, and ultimately cracking the target.
Alternatives to IsDebuggerPresent:
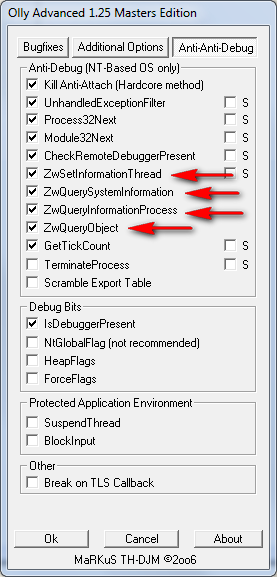
There are other ways of asking Windows if the current process is being debugged besides IsDebuggerPresent. One way is with the NtQuerySystemInformation or ZwQuerySystemInformation calls. The latter is an undocumented internal call that Windows uses directly, though both achieve the same result. The call definitions look like this:
ZwQuerySystemInformation( SystemKernelDebuggerInformation,
(PVOID) &DebuggerInfo, sizeof( DebuggerInfo ), &ulReturnedLength );
Just keep in mind that if you run across either of these functions, it is attempting to figure out whether the app is being run in a debugger. Most anti-anti-debugging plugins will thwart this, as we see in OllyAdvanced:
The Trap Flag:
This technique is nice in that it detects any debugger, no matter how ‘smart’ it is. This involves setting the trap flag in the current process and check whether an exception is raised. If an exception is not raised, you can assume that the debugger has ‘swallowed’ the exception to help us, and that the program is being single-stepped. Here is an example, using a combination of psuedo-code and assembly:
BOOL ExceptionFlagged = FASLE;
Try
{
pushfd
// Set the trap flag
or dword ptr [esp], 0×100
popfd
nop
}
exception handler:
{
ExceptionFlagged = TRUE;
}
if( ExceptionFlagged == FALSE )
print “A debugger has been found”;
When reversing code that looks like this, the pushad and popad instructions should jump out at you as you don’t normally see these instructions (unless we’re dealing with packed code, but that comes later). Obviously, the fix to this is NOPping out the if( ExceptionFlagged == FALSE ) check.
Checksums:
I had initially included a checksum routine in this crackme, as they are used heavily in the real world, but I wanted to minimize the complexity of the code. Checksums, or CRC Checks as they are more often called, are a method of checking for breakpoints and patches to the code. The basic idea is that, at some point in the application, we add up the byte values of all the opcodes in the binary and check this sum with a hard-coded value. This hard-coded value is obtained when the binary is completed, but before being published.
When we patch a binary, we obviously change one or more of these opcodes, so when we add in the opcodes for the patched instructions, the end value will not be the same. Therefore we can tell dynamically if the file has changed, and do what we wish once we know this (usually quit the app). This dissuades patches to the binary.
The way this technique detects breakpoints is in the way a debugger sets them. When you place a breakpoint on an instruction, the debugger replaces the opcode for this instruction with an interrupt opcode, namely 0xCC, and stores the original opcode internally. This allows the debugger to trap this interrupt, pausing the application and allowing us to step through the code. As we saw above, we can scan memory looking for this exact value of CCh (as we did in the breakpoint check routine in our crackme), but, as this instruction’s opcode was changed by the debugger, our checksum will also not match.
Let’s look at an example. Here is the disassembly of a simple call with opcodes:
75 34 JNZ 4010A0
Here, the 75h is the opcode for JNZ and the 34h is an offset from this instruction to jump to, meaning we will jump 34h bytes forward in the code from this instruction if the result is not zero. If we place a breakpoint on this JNZ instruction, even though Olly still shows the correct opcodes, in memory our instruction would really look like this:
CC 34 JNZ 4010A0
75h, the opcode for the JNZ instruction, has been replaced with CCh. This way, when the operating system hits a CCh opcode, it performs an interrupt, and Olly has been coded to trap this interrupt so that we regain control when the breakpoint is hit. When this happens, Olly copies the original value (75h) back into this address, replacing the CCh code with the real opcode.
Now, if we add the first two values in the above instructions we get 75h + 34h = A9h, which is our hard-coded checksum code. If we ran the checksum again after the breakpoint is set, we see that we get the value CCh + 34h = 100h, which does not equal the value it’s supposed to, namely A9. therefore, we now know that a breakpoint (or patch) has been set in this code, therefore the code is running in a debugger.
Conclusion
Anti-debugging is a very large field, and even though I’ve covered a number of them here, there are still far more out there, with new ones being developed all the time. If you wish to learn more, here is a list of some more in-depth coverage of these techniques, all available on the tools
page of the LegendOfRandom site:Anti-Debugging- A Developer’s Perspective by Tyler Shields
Nice overview with descriptions of each type. Also talks about PEB and TEB types of techniques.
Anti Reverse Engineering Guide
A .chm file (Windows help file) with three contributors supplying three takes on anti-debug techniques. Two are by Josh Jackson and one by Nicolas Falliere. The one by Falliere (the last) is the most detailed.
General Method of Program Code Obfuscation by Gregory Wroblewski
A long, very detailed analysis of code obfuscation techniques. Includes a lot of the math behind obfuscation analysis along with test programs to test the various techniques.
OllyDbg Detection Tricks by Pumqara
A tutorial on some specific methods of detecting OllyDBG. Includes source files to investigate.
Ultimate Anti Debugging Reference by Peter Ferrie
Peter Ferrie basically wrote the book on anti-debugging techniques. He has been doing research for a long time, and has come out with many cutting-edge techniques. this is his opus devoted to anti-debugging. It contains every anti-debugging technique I’ve ever seen. If you’re only going to have one resource, this is the one.
-Till next time
R4ndom
Addendum: Changing PE Section Attributes
One thing not mentioned earlier in the self-modifying code section was that in order to modify a binary’s code dynamically, the characteristics of the .text section must be changed to allow writing to them.
The .text section (where the runnable code is generally kept) is almost always set as read-only. Since we are modifying this code, we must add the write attribute to this section. If this is not done, when a disassembler hits the instruction that changes data in the binary, you will get an exception and the program will crash.
In order to change the characteristics, I use CFF Explorer. First, compile your program to create the exe file (using RadASM, WinASM etc.) Then open the exe in CFF Explorer and click on the “Section Headers” tab in the directory tree:
When you load your version, the characteristics value will be set to 40000020. Double-click this field and change it to C0000040 as I’ve done. Select “File”->”Save” and save the altered exe. Now when you run the application, the characteristics are set to “Execute as code”, “Readable” and “Writable”, allowing the binary to modify itself.


















September 14th, 2012 on 9:59 pm
Random,
Your code is awesome!
You’re a genius to me!
September 14th, 2012 on 11:00 pm
You are too kind. But from now on, can you add “evil” before any references to “genius”?
BWAHAHAHAHAHAHAHAHAHAHA…….
September 15th, 2012 on 2:01 am
I jst like al ur tutorial man.very neat and nicely explained keep it up hope ur site lives a million years
September 15th, 2012 on 7:24 am
R4ndom is simply the best in writing tutorials.
U truly are a “super duper evil genius”.
September 15th, 2012 on 7:05 pm
RDTSC = *ReaD* Time Stamp Counter, not “Real”
September 16th, 2012 on 6:33 am
I just felt awesome after completing your tutorial.
Thank you for this.
September 16th, 2012 on 7:22 pm
What is the editor you’re using for assembly?
September 17th, 2012 on 12:04 am
RadASM. I plan on writing a tutorial on using it shortly.
September 19th, 2012 on 2:09 am
Thank R4ndom so good tutorial.
September 19th, 2012 on 7:44 am
As an info almost All boardland Delphi programs has Return Obfuscation as it is a standard setting for the compiler.
September 19th, 2012 on 2:57 pm
I did not know that. Thanks XOR06.
September 21st, 2012 on 4:20 am
Pure awesomeness!! Keep posting ill keep reading and bookmarking. N I agree.. Pure genius!!
September 24th, 2012 on 1:47 am
so… if you dont have a legitimate serial and username some encrypted code would never be decryptable?
“After seven times through the loop, you will see the decrypted bytes in their entirety (keep in mind that you will only see this if you enter the correct serial)”
CB
October 6th, 2012 on 6:18 pm
One question about the .text section and modifying it to write instead of read only,
how come that in olly i am able to modify code while the program is running without having to change said attribute?does olly set those without having the user notice?
October 12th, 2012 on 6:13 am
Random could your please give the source code in text form. Thank you
October 12th, 2012 on 4:38 pm
Of course. I have added to the download. Please re-download it from the tutorials page and the zip will have the text file in it.
October 13th, 2012 on 2:39 am
Thank you R4ndom. But i could not compile the exe. As it says there is no windows.lib. Could you please guide me?
Thanking you
October 13th, 2012 on 3:05 am
That is an assembly file. You must run it through RadASM with the entire project to make an exe file. There was an exe file included in the download if that’s all you want.
October 13th, 2012 on 4:51 am
Thank your R4ndom for your reply. Could you please give the full project? I am a newbie, So error is there.
Thanking you.
October 24th, 2012 on 5:12 pm
Wouldnt the manual antidebug function that check 0xcc bytes give false positives?Every CC byte would trigger it
December 5th, 2012 on 12:16 am
R4ndom
Your tutorials are one of the best series that I have read.
Thanks!
March 8th, 2013 on 12:34 am
Excellent post. I used to be checking constantly this weblog and I’m inspired! Very helpful information specially the final phase I care for such info much. I was seeking this particular information for a long time. Thank you and good luck.
April 14th, 2013 on 2:25 am
when i open a software by Olly ,software auto run althought i not click run in olly and i can’t see code of software
i want ask what is this software use anti-debugging ?
sorry for my bad english
May 14th, 2013 on 10:10 pm
Cool Site , guys! Great Infos aswell. I bookmarked your site
May 17th, 2013 on 5:26 pm
I’m really impressed with your writing skills and also with the layout on your weblog. Is this a paid theme or did you modify it yourself? Either way keep up the excellent quality writing, it’s rare to see a nice blog like this one
nowadays.
September 22nd, 2013 on 8:55 am
Truly no matter if someone doesn’t understand after that its up to other viewers that they will help, so here it happens.